NEU: Das eBook.de Hörbuch Abo - jederzeit, überall, für nur 7,95 € monatlich!
Jetzt entdecken
mehr erfahren
Zustellung: Fr, 26.09. - Di, 30.09.
Versand in 7 Tagen
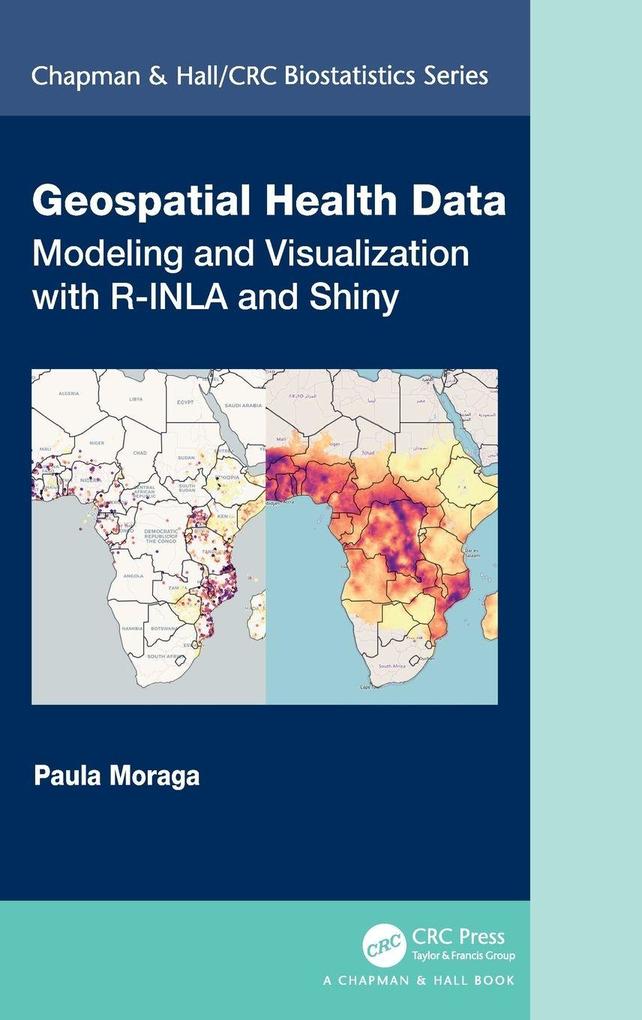
VersandkostenfreiThis book shows how to model disease risk and quantify risk factors using areal and geostatistical data. It also shows how to create interactive maps of disease risk and risk factors, and describes how to build interactive dashboards and Shiny web applications that facilitate the communication of insights to collaborators and policy makers.
Inhaltsverzeichnis
1. Geospatial health. 2. Spatial data and R packages for mapping. 3. Bayesian inference and INLA. 4. The R-INLA package. 5. Areal data. 6. Spatial modeling of areal data. 7. Spatio-temporal modeling of areal data. 8. Geostatistical data. 9. Spatial modeling of geostatistical data. 10. Spatio-temporal modeling of geostatistical data. 11. Introduction to R Markdown. 12. Building a dashboard to visualize spatial data with flexdashboard. 13. Introduction to Shiny. 14. Interactive dashboards with flexdashboard and Shiny. 15. Building a Shiny app to upload and visualize spatio-temporal data. 16. Disease surveillance with SpatialEpiApp.
Produktdetails
Erscheinungsdatum
25. November 2019
Sprache
englisch
Seitenanzahl
296
Autor/Autorin
Paula Moraga
Verlag/Hersteller
Produktart
gebunden
Gewicht
611 g
Größe (L/B/H)
240/161/21 mm
ISBN
9780367357955
Entdecken Sie mehr
Bewertungen
0 Bewertungen
Es wurden noch keine Bewertungen abgegeben. Schreiben Sie die erste Bewertung zu "Geospatial Health Data" und helfen Sie damit anderen bei der Kaufentscheidung.


